A strong social media reporting template does more than collect likes, reach, and follower counts. It turns scattered platform data into a monthly story a business owner, founder, or marketing lead can act on: what worked, what stalled, what changed, and what to do next.
The best reports are not longer. They are clearer. A good social report connects social activity to business outcomes such as qualified traffic, leads, email signups, booking requests, sales conversations, and customer retention. It also shows the working pattern behind those outcomes, so the next month is not just more posting. It is better decision making.
This guide gives you a practical structure you can reuse every month. Use it as a worksheet, slide outline, dashboard brief, or client report. The format works for Instagram, TikTok, LinkedIn, Facebook, YouTube Shorts, Pinterest, and X, but it is strongest when you combine native platform analytics with GA4 and clean UTM tracking.
Why a social media reporting template beats a raw metrics export
Raw exports are useful for analysis, but they rarely make a good report. A CSV can tell you a Reel received 18,000 views. It will not tell you whether those views came from the right audience, whether they created profile visits, whether the post drove website sessions, or whether the idea deserves another version next month.
A social media reporting template gives the numbers a job. Each section answers a decision-making question:
- Did social media help the business move toward its goals?
- Which platforms created the best return on time?
- Which content themes earned attention from the right people?
- Which posts should be repeated, expanded, or retired?
- What will change in the next reporting period?
That last question matters most. A report that ends with data but no next step is just a receipt. The goal is to make the next month sharper.
Social reporting also needs more context in 2026 because social performance is more fragmented. Hootsuite's 2026 trend research points to a shift away from treating follower count and generic engagement rate as the only proof of impact. Sprout Social's 2026 content strategy research also shows that teams are under pressure to connect content choices to audience expectations and business value. In plain terms: the report has to explain quality, not just quantity.
Start your social media reporting template with a one-page summary
Open the report with a short executive summary. Keep it to one page or one slide. Busy readers need the answer before the appendix.
Include these fields:
- Reporting period: the month, campaign window, or quarter covered.
- Main goal: awareness, engagement, traffic, leads, sales support, recruiting, community, or customer care.
- Top result: the clearest win from the period.
- Main issue: the biggest drag on performance.
- Recommendation: the decision you want the reader to approve.
Write the summary like a human would say it in a meeting. For example: "LinkedIn generated fewer posts than planned, but the educational carousel series drove the highest qualified traffic of the month. Next month, we should publish fewer broad updates and turn the carousel format into a weekly series."
That is more useful than "engagement increased 14%." The number still matters, but the decision matters more.
Build the core social media reporting template around goals
Do not start with every metric available. Start with the business goal, then choose the metrics that prove progress toward that goal. This keeps the report from becoming a wall of numbers.
Here is a clean goal-to-metric map:
| Goal | Primary metrics | Useful context |
|---|---|---|
| Awareness | Reach, impressions, video views, profile visits | Audience quality, repeat exposure, platform mix |
| Engagement | Engagement rate, saves, shares, comments, replies | Comment quality, content theme, post format |
| Traffic | Link clicks, sessions from social, landing page views | UTM consistency, bounce rate, engaged sessions |
| Leads | Form starts, form submits, bookings, email signups | Landing page conversion rate, offer quality |
| Sales support | Demo requests, assisted conversions, quote requests | Campaign source, content viewed before inquiry |
| Community | Replies, DMs, return commenters, sentiment notes | Common questions, objections, customer language |
The template should separate primary metrics from supporting metrics. Primary metrics answer whether the goal moved. Supporting metrics help explain why.
If the goal is leads, likes are supporting context. If the goal is awareness, reach and video views belong closer to the top. This sounds obvious, but many reports bury the real goal under default platform screenshots.
Need a cleaner monthly reporting system?
We help businesses and individuals build engaged audiences and drive real results through social media.
Use platform sections only after the main story is clear
After the summary and goal table, break the report down by platform. Keep each platform section consistent so the reader can compare performance quickly.
For each platform, include:
- Posts published
- Reach or impressions
- Engagement rate
- Top three posts
- Best content theme
- Best format
- Traffic or conversion contribution
- One recommendation for next month
Do not treat every platform the same. A good LinkedIn report may care about comments from target buyers, saves, profile visits, and website sessions. A TikTok report may care more about watch time, completion rate, shares, and repeatable hooks. An Instagram report may need to separate Reels, carousels, Stories, and static posts because each format has a different job.
The template should make those differences visible without forcing the reader to study every chart. One short platform note is often enough: "Instagram Reels drove reach, but carousels created more saves and profile visits. Keep Reels for discovery and use carousels for education."
Track engagement rate, but do not worship it
Engagement rate is still useful because it normalizes performance across account sizes and posting volumes. Hootsuite's 2026 benchmark guidance places many business engagement rates in a rough 2% to 4% range, though the number changes by industry, platform, and content format.
That range is a starting point, not a verdict. A small expert account can have a high engagement rate and still produce no leads. A B2B account can have modest engagement but attract the exact decision makers it needs. A viral post can inflate the monthly average while bringing in people who will never buy, book, subscribe, or return.
Use engagement rate in the template, but pair it with:
- Shares, because they show pass-along value.
- Saves, because they show future intent or usefulness.
- Comments, because they reveal language and objections.
- Profile visits, because they show curiosity beyond the post.
- Website sessions, because they show movement off the platform.
If you want a deeper measurement framework, connect this report to your social media ROI process. ROI does not have to mean every post gets a revenue number. It means the report is honest about the relationship between time, spend, content output, and business value.
Add GA4 and UTM tracking to your social media reporting template
Native social analytics tell you what happened on the platform. GA4 helps show what happened after the click. You need both.
Google's campaign URL guidance explains that UTM parameters pass campaign values into Analytics, where they can appear in acquisition reporting. For social reports, that means you can compare campaign traffic instead of guessing which post or platform sent visitors.
At minimum, use consistent UTM fields for:
- utm_source: instagram, linkedin, tiktok, facebook, pinterest, youtube, x
- utm_medium: organic_social, paid_social, influencer, partner
- utm_campaign: the campaign, promotion, or monthly theme
- utm_content: the post format, hook, creative version, or placement
Do not let every team member invent naming rules. Inconsistent UTMs make social reporting messy fast. Pick one naming format and document it inside the template.
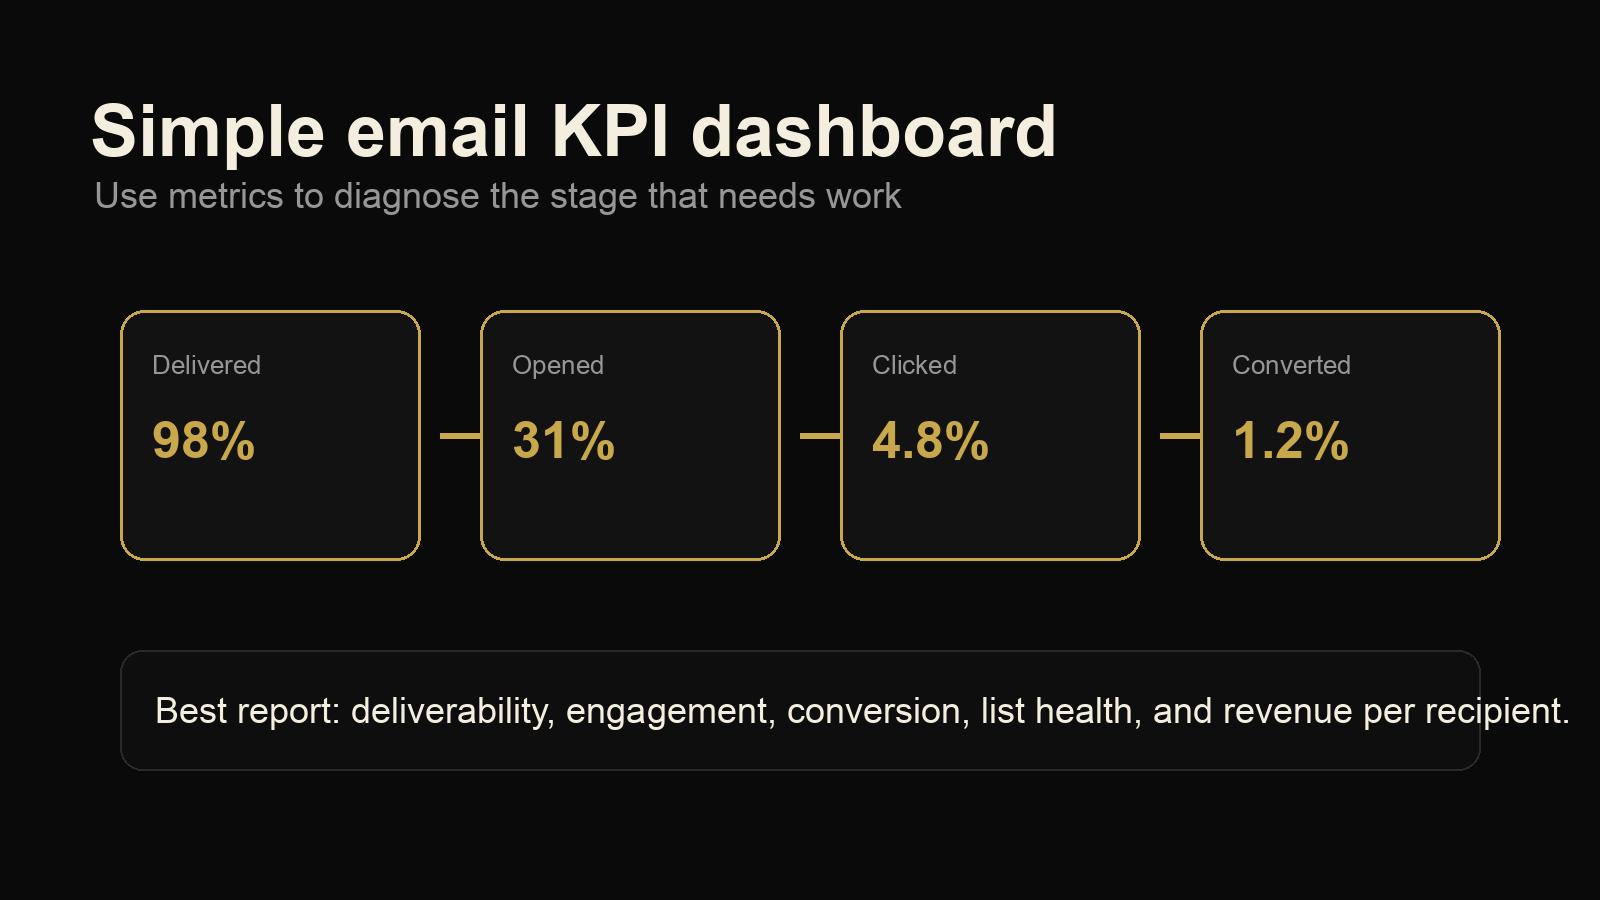
Your GA4 section can stay simple:
- Sessions from social
- Engaged sessions from social
- Top landing pages from social
- Conversions or key events from social
- Best source and campaign combination
If the website does not have conversion events configured yet, say that clearly in the report. Then make setup the next action. Reporting should expose tracking gaps, not hide them.
Include a content breakdown that explains why posts worked
A strong social media reporting template includes a section for content patterns. This is where the report becomes useful for planning.
Group posts by theme and format. For example:
- Educational posts
- Behind-the-scenes posts
- Case study posts
- Opinion posts
- Product or service explanation posts
- Community or customer question posts
Then compare each group by reach, engagement rate, saves, shares, comments, clicks, and conversions where available. You are looking for patterns, not just winners.
A single top-performing post may be a lucky outlier. Three posts in the same theme performing well is a signal. If educational carousels keep driving saves and website clicks, that theme deserves more space in the next calendar. If short trend posts keep getting views but no profile visits, they may be entertainment without strategic value.
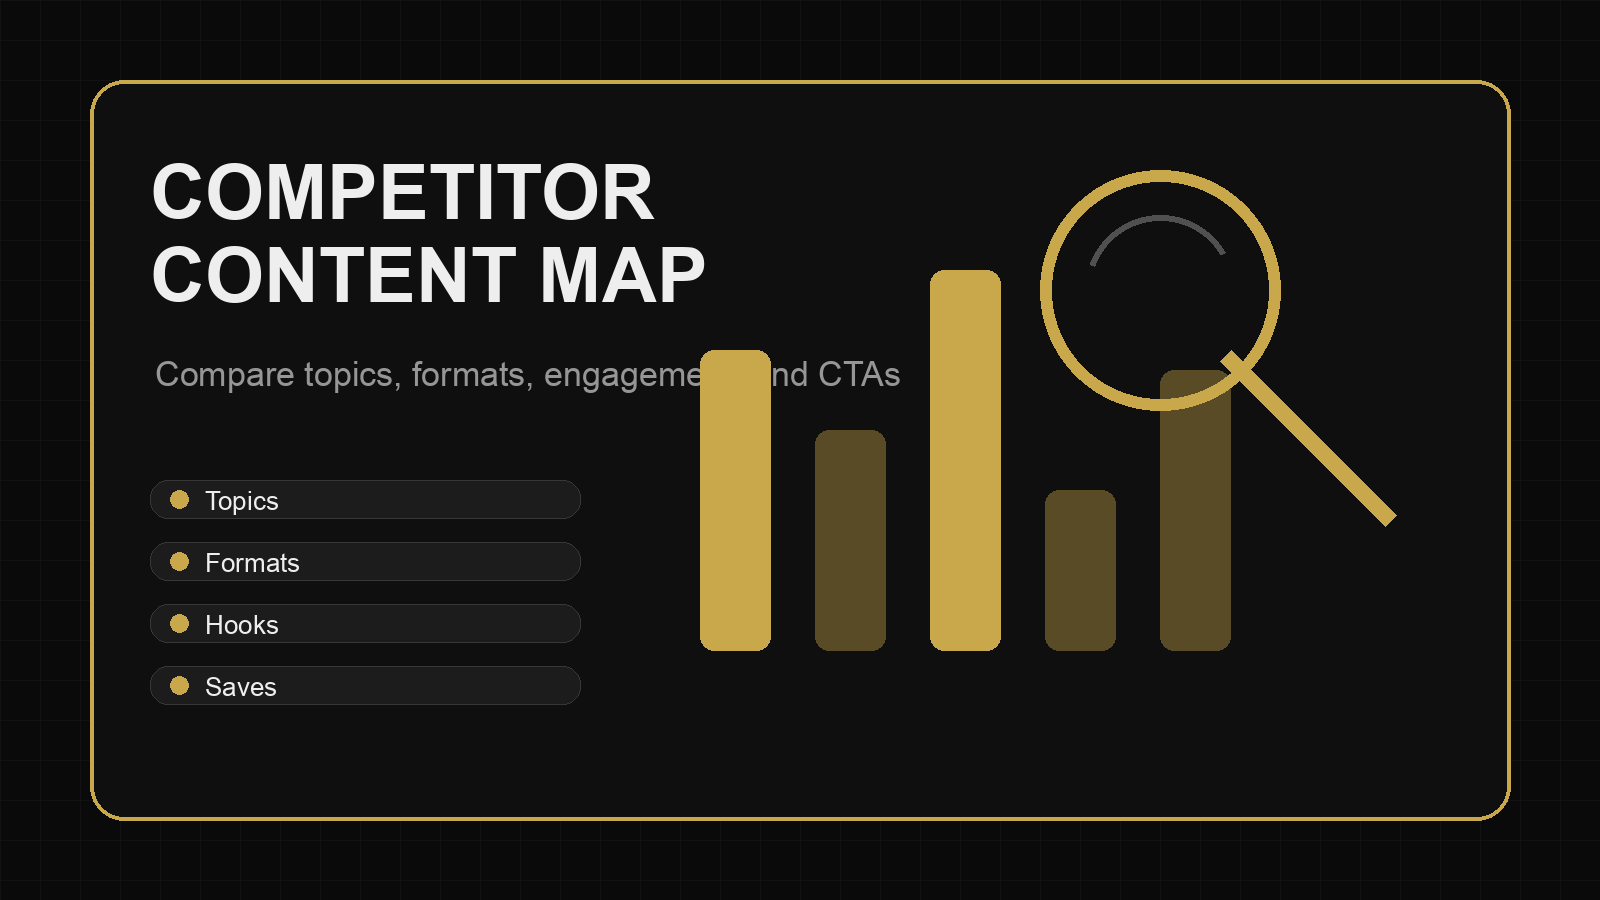
This section pairs well with a social media competitor analysis. Competitor data can show which formats are common in your market, where competitors are overposting, and where your account has room to sound more useful or more specific.
Turn the report into next month's action plan
The final section should be a short action plan. Keep it concrete. A reader should know exactly what will happen next.
Use this format:
- Keep: the content or platform behavior that is working.
- Stop: the effort that is taking time without producing useful results.
- Test: the new idea, format, hook, offer, or posting rhythm to try next month.
- Fix: the tracking, landing page, creative, or workflow problem holding results back.
Here is an example:
- Keep: weekly LinkedIn carousels tied to customer questions.
- Stop: reposting the same short video clips across every platform without adapting the hook.
- Test: two founder-led educational videos with direct calls to a downloadable checklist.
- Fix: UTM naming so GA4 can separate LinkedIn organic posts from paid boosts.
This turns the report into a management tool. It also makes accountability easier. Next month, you can check whether the team actually made the change.
Social media reporting template you can copy
Use this outline for your next monthly report:
- Executive summary: top win, main issue, recommendation.
- Goal review: the business goal and primary metrics.
- Platform performance: one section per platform.
- Top content: best posts, formats, themes, and lessons.
- Traffic and conversion review: GA4 sessions, landing pages, and key events.
- Audience and community notes: questions, objections, sentiment, and common language.
- Competitor context: useful comparison points, not vanity benchmarking.
- Next month's action plan: keep, stop, test, fix.
If you are reporting to an owner or executive, lead with the summary and action plan. If you are reporting to a marketing team, spend more time on content patterns and platform detail. If you are reporting to a client, include both the decision summary and the supporting evidence.
The template is only as good as the decisions it creates. If the same metrics appear every month but nothing changes, the report is not doing its job. Tighten it until every section earns its place.
Want monthly reports that lead to better decisions?
We help businesses and individuals build engaged audiences and drive real results through social media.